Trading Tools & Platforms
January 6, 2021
By Acuity Trading
Benjamin Franklin once said, “If you fail to plan, you are planning to fail.” The saying holds so true for the world of trading.
For long-term success in the chaotic financial markets, one of the most important things is a trading plan. A trading plan identifies your goals, helps organize your market research and identify which positions to take and in what direction. However, to create this plan, you need the support of robust trading tools.
The Different Trading Tools
To assess trading signals for a reliable trading plan, traders can access a wide variety of tools, depending on the online trading platform they use. Some of the key tools are:
Charts
Charts are distinct patterns developed due to the price movement of an asset. Traders use chart patterns to gain insights into future price movement. A price pattern can be a continuation pattern or reversal pattern.
Continuation patterns suggest that the price trend is likely to continue in the near future. Some of the commonly used chart patterns are:
- Pennants
Pennants are drawn using 2 trendlines that finally come together. A decrease in volume is often seen in the formation of this pattern. This is followed by an increase when the price breaks out.
- Flags
Flag patterns get their name from their distinct shape. There are 2 separate parts of this pattern, the flagpole and the flag. Flags are areas of tight price consolidation, while the flagpole represents the price direction outside this pattern. A flag pattern can be bullish as well as bearish.
- Triangles
Triangles are one of the most popular chart patterns. There are 3 types of triangle patterns, created due to the convergence of trend lines.
- Ascending triangles – These are characterised by a horizontal top trendline and an increasing bottom trend line.
- Descending triangles – Here, the pattern is created by a series of continuously declining highs.
- Symmetrical triangles – In this pattern, both trendlines are moving towards each other.
On the other hand, reversal patterns suggest that the bears or bulls are running out of steam. They point towards a change in the direction of the trend. Some of the commonly used reversal patterns are:
- Head and Shoulders
The head and shoulders pattern is characterised by 3 peaks. The middle peak is the highest, while the two outside peaks are slightly lower and of similar height. This gives it a resemblance to a head and two shoulders.
- Gaps
When an empty space is created between 2 trading periods, due to significant price increase or decrease, a gap is created. The 3 major types of gaps are runaway gaps, exhaustion gaps, and breakaway gaps.
Technical Indicators
The aim of technical indicators is to figure out trading opportunities. For this, technical indicators use historical data, such as volume, price and open interest. Technical indicators can be broadly divided into leading indicators and lagging indicators.
- Lagging Indicators
Like the name suggests, lagging indicators follow the market and the price action. They provide a signal once the pattern has been already completed. Lagging indicators are often used to confirm a trend. Before entering a trade, traders usually use 2 or 3 lagging indicators to confirm a price trend. Some of the popular lagging indicators are moving averages, MACD, Bollinger Bands, standard deviation and average true range.
- Leading Indicators
Leading indicators anticipate future market sentiment and price movements. This is done by using historical data to project future movement. By anticipating future market sentiment and price, traders can enter positions at the start of the move. Some of the popular leading indicators are parabolic SAR, stochastic oscillator, commodity channel index, and the relative strength index.
<!–[if lte IE 8]>
<script charset=”utf-8″ type=”text/javascript” src=”//js.hsforms.net/forms/v2-legacy.js”></script>
<![endif]–>
<script charset=”utf-8″ type=”text/javascript” src=”//js.hsforms.net/forms/v2.js”></script>
<script>
hbspt.forms.create({
portalId: “7797319”,
formId: “78c871c3-24ac-4455-a25c-4b28082a1bf8”
});
</script>
News Sentiment Tools
News sentiment is a forward-looking data set, making it a leading indicator. It reflects the underlying feeling in the market, based on the latest news events. By understanding the current feelings of market participants, traders gain an insight into possible future movements.
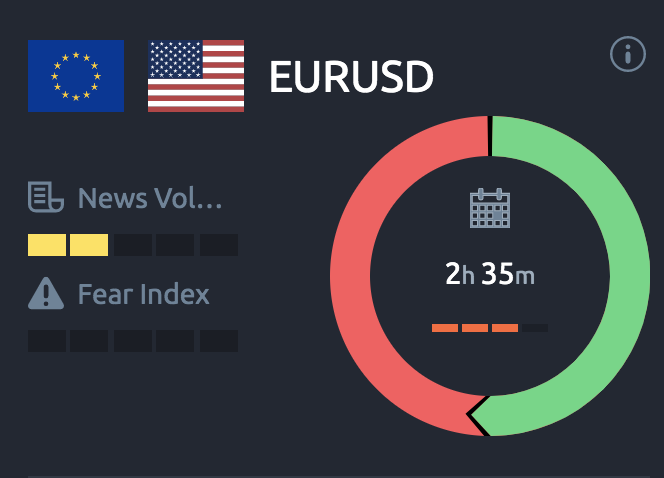
When the market reflects a high risk appetite, it tends to experience a strong reaction to positive news and headlines. When traders have low risk appetite, there are stronger reactions to downbeat news. Which is why news sentiment tools are incredibly useful.
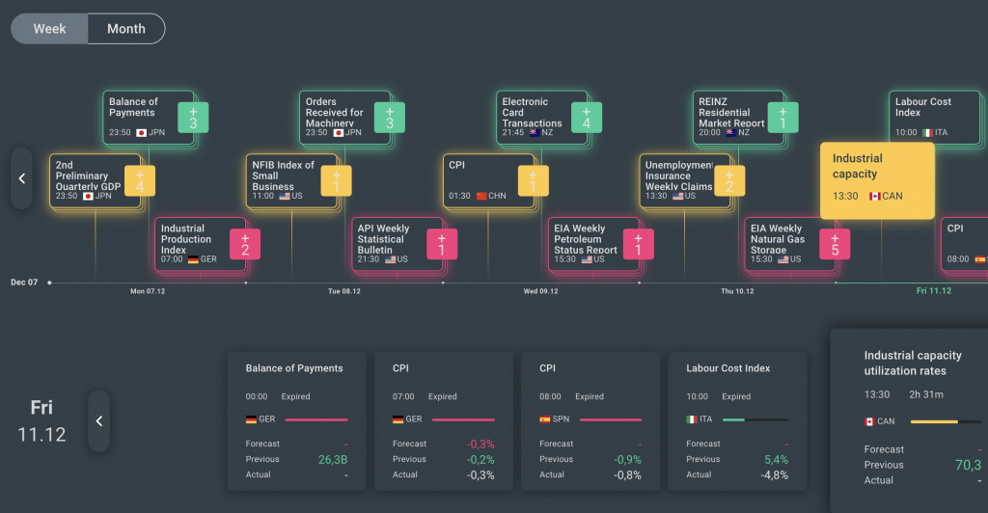
Economic Calendar
An economic calendar displays the scheduled data releases and events that impact the financial markets. These releases can include information such as interest rate decisions by central banks, the latest GDP growth rate figures, and the US non-farm payroll numbers. Monitoring economic data releases can help traders predict market volatility and moves.
The Next Generation of Trading Tools
Traditional trading tools have served traders extremely well. But as computation capacities have improved, AI-based trading indicators and signals are now available for better and faster decision making. With technologies such as artificial intelligence and machine learning, huge quantities of data can be processed to provide more accurate trading signals.
AI and natural language processing also help turn massive amounts of unstructured information into actionable information. They can detect even the most subtle changes and patterns, which are not visible to the naked eye.
Also, with AI and NLP, it has also become possible to identify multi-hop relationships to make connections between assets and other data sets. Large data sets, despite the number of connections, can be analysed at lightning-fast speeds. On the other hand, earlier, analysing a large number of relationships (hops) was extremely time and resource intensive. In fact, analysing relationships beyond 3 hops wasn’t possible with traditional methods.
These AI-based signals can tell traders about when to buy or sell an asset, the target price, stop loss price and entry price. Technologies such as AI and NLP use price action, currency evaluation, news/social media analysis, and technical analysis to provide actionable insights to traders. For example, using NLP and AI, large volume of news is processed, and sentiment is extracted from it. This transforms unstructured news text into structured data sets. It helps tame, or manage, what has been termed ‘infobesity’.
Which Trading Tool Should You Use?
The answer is not to use just a single leading or lagging indicator, but a combination of tools. The concept of “traffic light signals” can be incredibly beneficial for this. With this, if a trader has access to multiple tools, they can use each one individually to form an opinion. When used together, a much stronger opinion can be formed.
Depending on whether a tool is providing a favourable signal or not, a trader could treat them like a traffic signal, assigning each indicator a different colour, from green to red. So, if one indicator is ‘green’ and so are the others, this would be a strong signal. On the other hand, if there is just one ‘green’ signal, the trader might prefer to continue their research till they find a stronger signal.
Conclusion
Today, traders can access a wide variety of trading tools to enhance trading decisions. So, why not take full advantage of them? Independently, trading tools are great. But when used together they can be much more powerful. So, traders could use leading trading tools, such as news sentiment, along with lagging technical indicators, such as MACD and Bollinger Bands. This would help them take advantage of market opportunities and weed out false signals.
More news
How to Support Your Traders in 2025
2025 will be a year of divergence for the financial markets due to increased complexity and fluidity. Interplay of forces, such as political...
Acuity Trading Tools Now Integrated with cTrader Platform: Enhancing Trading Experiences for Brokers and Traders Alike
Acuity Trading is thrilled to announce the integration of its powerful suite of tools with the cTrader platform, making it easier than ever for...