August 3, 2020
By Acuity Trading
Whether it is a Presidential tweet or a massive earthquake rocking an Italian village, every bit of news has the power to spur market volatility. But, traders cannot rely on news alone; they need concrete economic data and statistics, released by official statistical bodies, to understand the fundamentals of an economy or a company. These fundamentals drive asset valuations, thereby impacting a trader’s long-term returns.
Economic and corporate calendars are powerful and indispensable trading tools, helping investors follow key economic and non-economic indicators that can provide clues to subsequent market direction. This is because, rather than the release of actual economic or corporate indicators, it is the anticipation of the data that drives market sentiment. The figure itself might not be as critical as whether it met market expectations or not.
This collective anticipation can be termed market sentiment. A variety of news articles, analyst reports, earnings expectations and more contribute to shaping this sentiment, making it an incredibly rich and varied data set.
The Dual Power of Calendar and Sentiment Data
So, news volume data is a leading indicator of market volatility. The more data releases scheduled for an asset on the calendar, the greater the probability of a rise in news volume and, ultimately, shifts in market momentum.
A scheduled event, unlike a shock event such as an earthquake, means the market will try to factor in the ‘expected’ data before the event has happened. This in turn causes volatility prior to the announcement and depending on whether the data has met expectations or not, can continue for many days afterwards.
For example, if analysts’ estimates for apple earnings are set at 25c per share, investors will focus on the number and to whether they think it will come in at above or below. This in turn will drive news volume and sentiment. The estimates are therefore a yardstick by which the sentiment is judged.
By combining calendar data with sentiment data, traders can better understand and monitor market activity so they can formulate trade ideas accordingly. After all, in this era of globalisation, economic data of one country impacts global assets across the board.
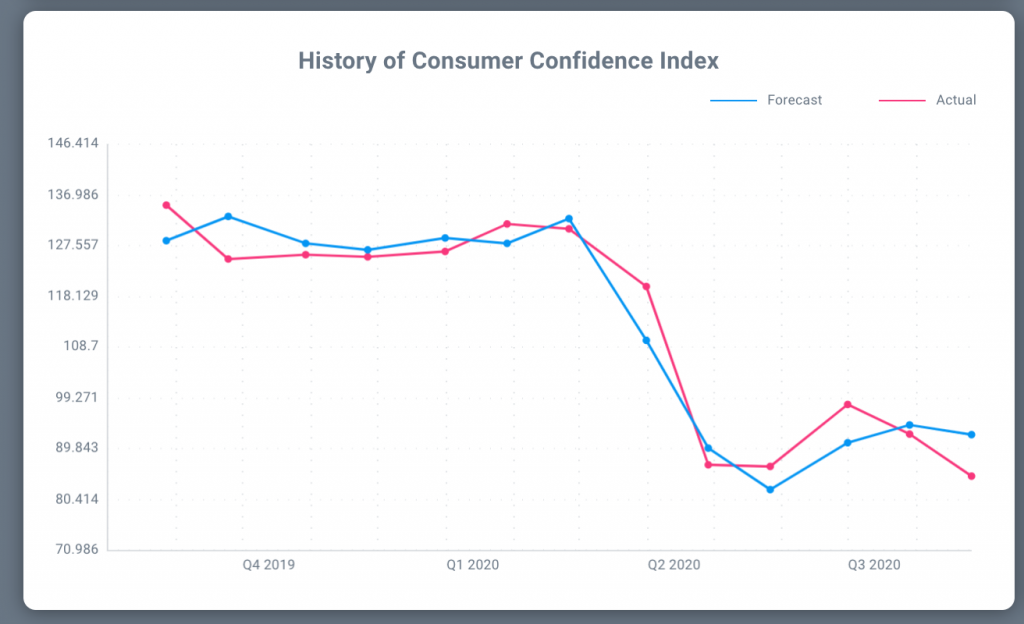
For example, on August 26, 2020, the Shanghai Composite fell by 1.3% to 3329.74, as investor sentiment turned negative, following a drastic drop in US Consumer Confidence. The US consumer confidence index dropped to 84.8 in August, the lowest level since May 2014. This was significantly lower than the market consensus of 93 You can see how the data has compared with analysts expectations over the past 12 months in Acuity’s economic calendar.
This signifies growing worry in households over the labour market and incomes, as well as lack of confidence in the US economy to recover from the COVID-19 induced downturn quickly. The worry is compounded by millions being unable to pay rent and the resurgence of coronavirus cases in the country.
How to Use the Calendar Data and Sentiment Data to Trade
If market volatility levels pre and post a calendar event can be ascertained, traders can ensure appropriate risk management measures to mitigate the risks of trading during such periods.
News volume, fear sentiment and event significance data are useful indicators pre-event. Traders can be more discerning in their asset selection, choosing the assets and events most suited to their risk appetite or avoid them altogether.
Conversely, Acuity’s Potential Range indicator helps identify the extent of volatility over set time frames after an event which can determine optimal entry and exit positions.
Picking the Right Assets to Trade
Using Acuity’s sentiment data, together with the calendar data, stock picking or choosing the right assets is made easier for traders. The “Fear Index” and the News Volume bar provide sentiment data that is not only based on a handful of economic indicators, but on tons of market news and report analyses released daily. The greater the news volume, the more the resulting volatility is greater the risk but also more likely to lead to trading opportunities.
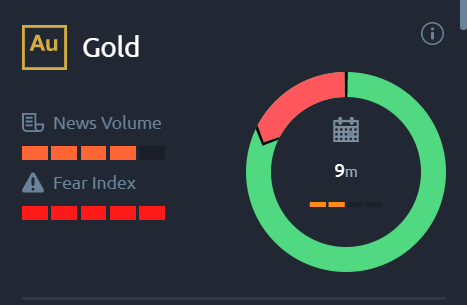
For example, the safe-haven asset gold shows huge scope for market volatility, as multiple news releases worldwide impact its price trends. Economic gloom spells bullish sentiment for gold and vice versa.
Note how with only 9 minutes until the next calendar event, high news volume and positive sentiment dominates the asset but the Fear Index is at the maximum, causing sentiment to turn bearish as the event draws closer.
Timing the Trade
Knowing when a scheduled event is happening is vital to any trading strategy but to optimise the entry and exit positions of a trade, knowing how the volatility fluctuates over the event period is going to be more effective.
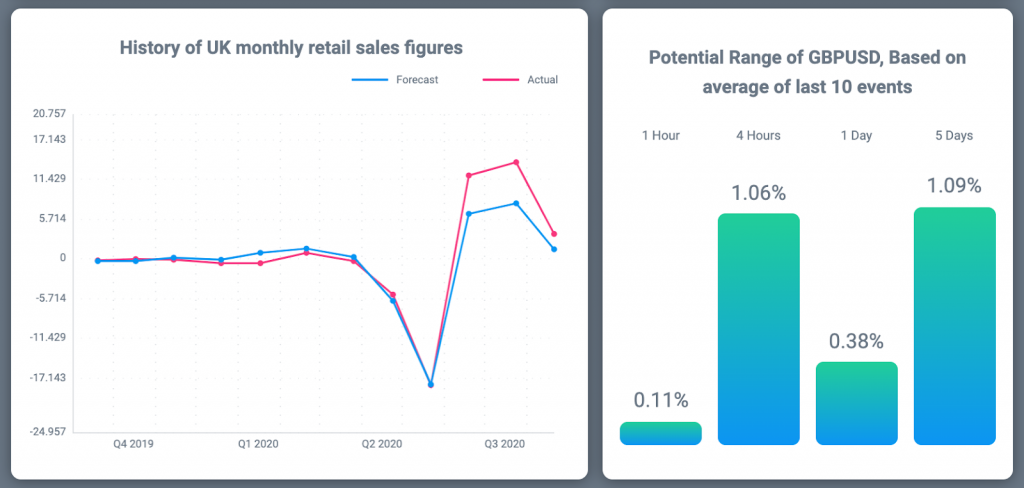
Acuity’s Potential Range data uses historical calendar and price data to generate an average range of movement 1 hour, 4 hours, 1 day and 5 day for affected assets after every event.
In this example, GBPUSD fluctuates between 0.11% and 1.09% over a period of 5 days after the UK Monthly Sales Figures are announced. Traders with an interest in this asset will be able to time their trades more effectively to take advantage of these movements or use it as a guide to limit their exposure until the impact of the event has been priced in by the market.
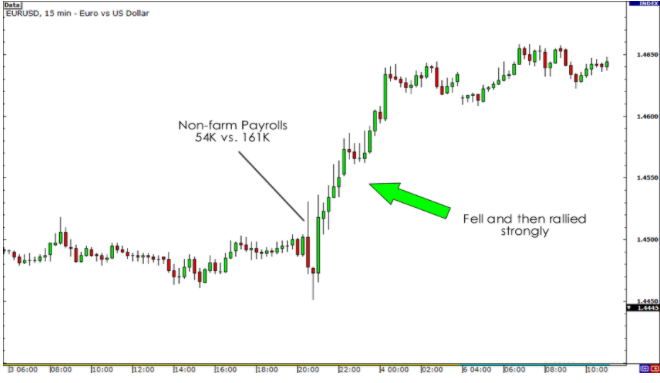
we look at this 15 minute chart example from 2011, when trading forex with the US Non-Farm Payroll (NFP) Report, it is important to see the way the price moves right after the release. Many times, the EUR/USD pair fakes one direction first, and then reverses and rallies in the opposite direction.
A dismal figure of 54,000, against an expected figure of 161,000, led to the EUR/USD declining initially, but later surging 175 pips over a 4-hour period.
By incorporating various news sentiment indicators with calendar data, traders no longer need to fear volatility. Instead, they can use the data to refine their strategies, taking advantage of the opportunity it presents whilst mitigating the risks at the same time.
More news
Is Xi Jinping Shifting his Stance Towards Chinese Tech Companies?
On February 17, 2025, China’s President Xi Jinping called a meeting of prominent tech leaders in the country, including Alibaba’s co-founder, Jack...
Australia’s Economy Continues Declining. Is Low Tech Adoption to Blame?
Australia, once called the "economic poster child," has now been termed a "problem child” by McKinsey. The nation had witnessed 33 consecutive years...