Key Update
May 6, 2025
By Joe Neighbour
See profile
April 2025 marked a dramatic escalation in global market turbulence, driven by the introduction of sweeping US tariffs that triggered historic volatility across financial assets. President Trump’s April 2 tariff package imposed a baseline 10% levy on nearly all imports, with much higher rates for China, Canada, and Mexico, upending trade relationships and sending shockwaves through international markets. The S&P 500 and Nasdaq plunged into bear market territory, erasing trillions in value in the first week of April before staging a partial recovery as risk appetite cautiously returned. These policy shifts intensified inflationary pressures and raised the spectre of slower global growth, as retaliatory measures from major trading partners further unsettled the outlook.
Amid this turmoil, our trading signals contended with extreme volatility, reflecting the broader market’s struggle to price in the economic and geopolitical fallout from the new tariff regime.
Asset Class Summary
Forex
The EUR/USD pair exhibited significant volatility following the announcement of new US tariffs on EU goods, surging from 1.08 to 1.1150 in early April before stabilizing around 1.10 as the market awaited EU countermeasures and the ECB's rate decision. The euro's rise was primarily fuelled by a pronounced sell-off in the US dollar, although further appreciation was limited by persistent trade policy uncertainties and the anticipated 0.25% ECB rate cut later in the month. Meanwhile, GBP/USD demonstrated seasonal resilience, supported by historical April patterns and a weaker US dollar, although the broader FX markets remained wary due to tariff and recession concerns.
Indices
Global equities experienced an unprecedented two-day decline following the US tariff announcement on April 2, with both the S&P 500 and Nasdaq dropping approximately 10% and entering bear market territory. More than $6.6 trillion in market value was erased in the first week. However, by mid-month, sentiment shifted positively: technology, growth, and momentum stocks made a robust recovery, regaining much of their early-April losses by the end of the month. The "Mag Seven" tech giants, after significant downturns, concluded April near their initial market capitalisations, indicating a renewed appetite for risk and a resurgence of 2024’s market influences.
Commodities
Brent crude prices experienced a steep decline, falling below $66 per barrel following OPEC+'s decision to increase production and rising concerns over demand due to tariffs. Gold continued to be sought after as a safe haven amidst market instability and geopolitical tensions, maintaining a price above $2,980 per ounce. Industrial metals remained under pressure due to weak economic data from China and increasing trade barriers.
Cryptocurrencies
Bitcoin and Ethereum mirrored equity market volatility, declining early in the month alongside tech stocks but stabilising as risk appetite returned, maintaining a strong correlation with the Nasdaq’s movements.
With tariffs now a central driver of market direction, investors face heightened uncertainty around inflation, global growth, and the durability of the equity rebound. The outlook for Q2 hinges on the evolution of trade negotiations, the response of major central banks, and the potential for further escalation or resolution in the ongoing tariff standoff.

The simulated performance statistics provided are based on the assumption of risking 1% of trading capital per trade. It is crucial to understand that past performance, whether actual or simulated, is not indicative of future results.
12 month simulated performance statistics
| May 24 | Jun 24 | Jul 24 | Aug 24 | Sep 24 | Oct 24 | Nov 24 | Dec 24 | Jan 25 | Feb 25 | Mar 25 | Apr 25 |
| 15.15% | -2.77% | -7.69% | -8.92% | 20.16% | -18.47% | -15.68% | 27.29% | 12.66% | 16.50% | -7.53% | -19.13% |
Asset Class Performance
Indices emerged as the top-performing asset class in March, delivering a strong 17.53% return with a 49.32% win rate across 73 trades, and maintaining a low drawdown of -3.34%, indicating both profitability and effective risk control.
FX Majors also performed well, posting an 11.58% return and a 50.75% win rate over 67 trades, though with a moderately higher drawdown of -6.28%.
In contrast, FX Crosses saw significant losses, recording a -18.27% return, the lowest win rate at 39.80%, and the highest drawdown of -18.99%, suggesting poor trade outcomes and elevated volatility.
Commodities struggled the most, falling -28.83% with a low 21.43% win rate, and matching drawdown of -28.83%, highlighting persistent losses and ineffective risk mitigation.
Cryptocurrencies experienced modest losses, posting a -2.02% return despite a relatively strong 51.61% win rate, but were impacted by a drawdown of -4.48%.
Overall, Indices led the month with strong gains and stable risk, while Commodities and FX Crosses suffered the sharpest declines, underlining a wide divergence in asset class performance.
Overall, FX Crosses led the month, while Indices faced the sharpest losses, highlighting a mixed performance across asset classes.
| Asset Class | Trades | Win Rate | Returns | Drawdown |
| FX Majors | 67 | 50.75% | 11.58% | -6.28% |
| FX Crosses | 98 | 39.80% | -18.27% | -18.99% |
| Commodities | 70 | 21.43% | -28.83% | -28.83% |
| Indices | 73 | 49.32% | 17.53% | -3.34% |
| Cryptocurrencies | 31 | 51.61% | -2.02% | -4.48% |
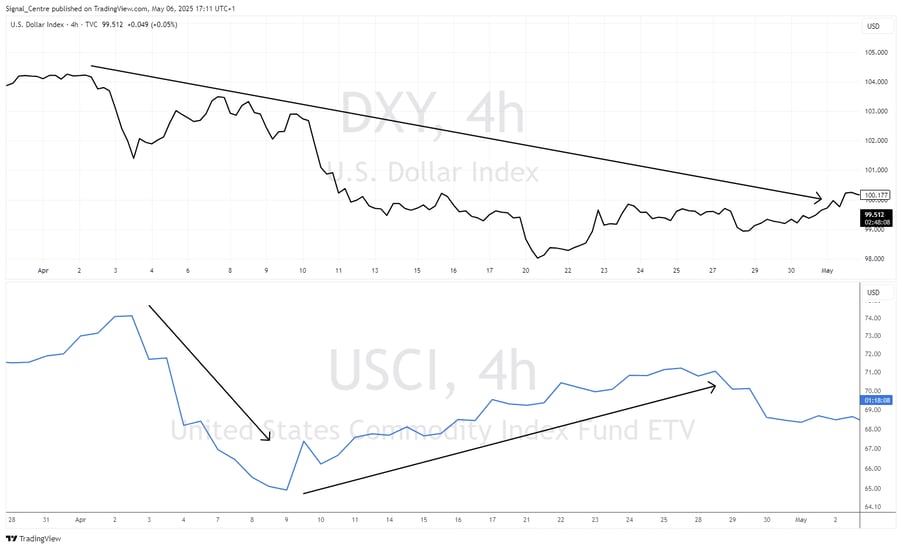
The chart below illustrates the divergent performance between the Dollar Index (black) and the United States Commodity Index Fund (blue). Throughout the month, the US Dollar exhibited a downward trend, providing a consistent pattern for our analysts to leverage within the FX Majors. Conversely, Commodities experienced significant volatility, with frequent 6-8% fluctuations over short intervals. These volatile conditions posed considerable challenges for our analysts as they endeavoured to manage the erratic price movements. Although we capitalised on favourable conditions in the FX Majors, the volatility in FX Crosses and Commodities presented greater challenges. Consequently, our negative returns for the month were largely attributed to losses in the commodity sector.
Best/Worst Performing Markets
USDJPY emerged as the top performer, delivering the highest return of 7.94% with an impressive win rate of 81.82% over 11 trades, primarily short positions (7 short vs. 4 long), though it faced a moderate drawdown of -2.01%.
US2000 followed with a solid 6.85% return and a 66.67% win rate across 9 trades, maintaining a fairly balanced trade distribution (5 long, 4 short) and a low drawdown of -1.01%.
AUDUSD also performed well, posting a 6.30% return and a 62.50% win rate from 8 trades (5 short, 3 long), though it experienced a slightly higher drawdown of -1.76%.
In summary, USDJPY led both in returns and win rate, while US2000 and AUDUSD demonstrated strong consistency and sound risk control with balanced trade structures.
| Best | Trades | Long | Short | Win Rate | Returns | Drawdown |
| USDJPY | 11 | 4 | 7 | 81.82% | 7.94% | -2.01% |
| US2000 | 9 | 5 | 4 | 66.67% | 6.85% | -1.01% |
| AUDUSD | 8 | 3 | 5 | 62.50% | 6.30% | -1.76% |
Brent was the poorest performer, posting a -7.01% return with a win rate of just 10.00% across 10 trades (predominantly 7 long vs. 3 short), and a significant drawdown of -5.92%, reflecting weak trade outcomes and high risk exposure.
Oil also showed considerable underperformance, delivering a -6.27% return and the same low 10.00% win rate from 10 trades (also 7 long, 3 short), alongside a drawdown of -5.20%, signalling persistent losses across its positions.
Palladium fared slightly better but still recorded a -5.18% return with a 25.00% win rate over 12 trades (heavily skewed toward 10 long vs. 2 short), and a drawdown of -4.38%, indicating difficulty sustaining profitable trades despite broader participation.
In summary, Brent and Oil led the group in losses with notably poor win rates, while Palladium struggled as well, albeit with marginally better trade success and risk management..
| Worst | Trades | Long | Short | Win Rate | Returns | Drawdown |
| Brent | 10 | 7 | 3 | 10.00% | -7.01% | -5.92% |
| Oil | 10 | 7 | 3 | 10.00% | -6.27% | -5.20% |
| Palladium | 12 | 10 | 2 | 25.00% | -5.18% | -4.38% |
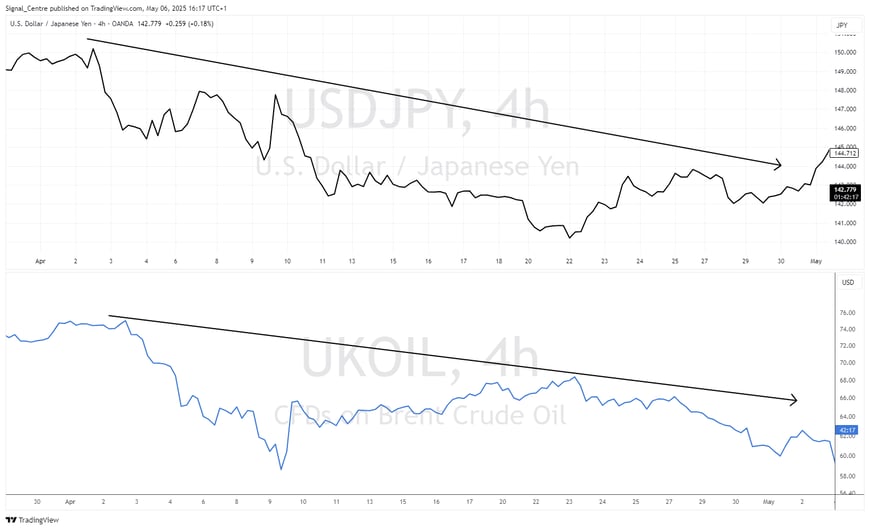
In April, USDJPY exhibited the most robust performance, generally trending downward but offering countertrend opportunities that our analyst effectively leveraged, achieving a 7.94% return with effective risk/reward management.
Conversely, Brent Oil encountered substantial volatility. The unpredictable price movements within a downward trend created challenging conditions, resulting in a -7.01% return, which made it one of the more challenging assets to trade during the month.
Major Macroeconomic Data
Here is a snapshot of how our trade ideas performed on the day of key macroeconomic data.
Non Farm Payrolls - 4th April 2025
| Event | Date | Trades Triggered | Win Rate | Return |
| Non Farm Payrolls | 04/04/2025 | 11 | 18.18% | -5.84% |
The April Non-Farm Payroll report significantly exceeded expectations, recording 228k compared to the projected 140k. This resulted in an upward movement in the US Dollar, counteracting some of the previous session's weakness. The unexpected countertrend move led to losses in EURNZD, EURJPY, USDCAD, and Gold. However, USDJPY stood out as a success, achieving its profit target.

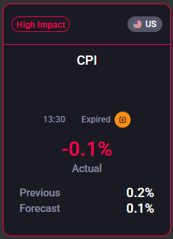
US CPI (MoM) - 10th April 2025
| Event | Date | Trades Triggered | Win Rate | Return |
| US CPI (YoY) | 10/04/2025 | 15 | 33.33% | -3.47% |
The US CPI figure was lower than anticipated at -0.1% compared to the expected 0.1%, prompting a significant sell-off in the US Dollar, which persisted until it temporarily stabilised on April 21st. Our short position on USDJPY reached its target, and there were modest gains on Platinum, AUDJPY, and DOW30.
Trade of the Month
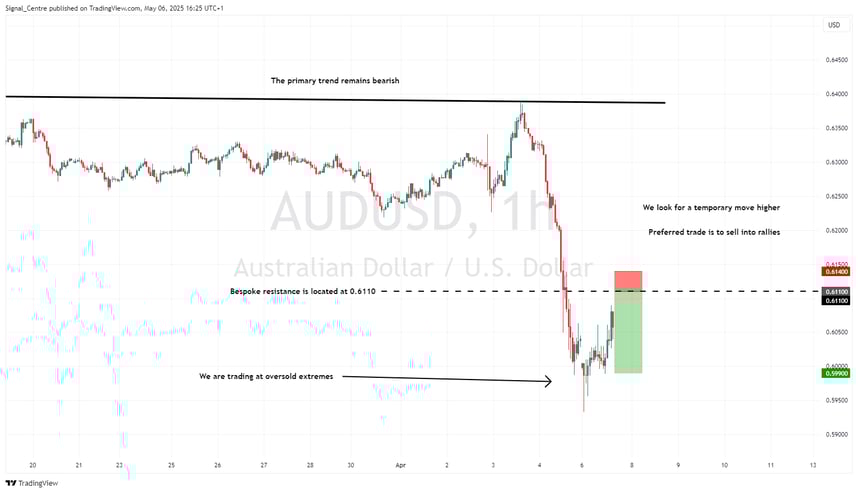
Our team of expert analysts performs daily market assessments to uncover premier trading opportunities. Each analyst contributes a distinct perspective, utilising their extensive expertise to generate precise market forecasts. In April, our highlighted trade focused on AUDUSD. By detecting a persistent downtrend in the charts, our analyst identified the opportunity to sell during rallies, anticipating a further decline in price. They forecasted a minor upward correction to establish an entry point with a favourable risk-to-reward ratio, using traditional technical analysis to determine exact entry and exit points. This strategic approach highlights our team's ability to foresee significant market movements that can result in considerable profits when executed successfully.
AUDUSD - 7th April 2025
- Direction: Sell
- Entry Level: 0.6110
- Stop: 0.6140
- Target 1: 0.5990
- Target 2: 0.5970
- Risk/Reward: 1 : 4
The setup
- The primary trend remains bearish
- We are trading at oversold extremes
- We look for a temporary move higher
- Preferred trade is to sell into rallies
- Bespoke resistance is located at 0.6110
Here's a graphical depiction illustrating the trade setup and the analytical process behind AUDUSD.
The Outcome
AUDUSD reached our designated entry point at 15:11 (UK) as prices ascended. We experienced a slight drawdown of 17 pips. The price rapidly declined from a peak of 0.6127, reaching our initial target of 0.5990 within two hours. It continued its descent after hitting the first target, achieving our second target of 0.5970 just a few minutes later.
Published: 07:49 UK (7th April 2025)
Triggered at: 15:11 UK (7th April 2025)
Exit at: 16:15 UK (7th April 2025)
Duration: 1 Hours and 4 minutes
Outcome: 4R
Despite April's sharp rise in global market volatility and significant losses in commodities and FX Crosses, there were clear signs of resilience and opportunity. Standout performances from USDJPY, US2000, and AUDUSD, along with strong asset class gains in Indices and FX Majors, showcased our ability to identify and capitalise on high-conviction trades even in turbulent conditions. Our trade of the month on AUDUSD, which delivered a swift and precise 4R return, underscores the value of disciplined analysis and risk management. As we move into May, we remain focused and optimistic, confident that our adaptable strategies will continue to uncover strong opportunities across dynamic and evolving markets.
Thank you for your continued trust in Acuity Trading. Stay tuned for more updates and insights in the coming months.
Risk Warning
The simulated performance statistics provided are based on the assumption of risking 1% of trading capital per trade. It is crucial to understand that past performance, whether actual or simulated, is not indicative of future results. Trading involves substantial risk and is not suitable for every investor. The figures presented are hypothetical and do not account for real market conditions, such as liquidity, slippage, or transaction costs. You should be aware of the risks involved and be prepared to potentially lose your entire investment. Always seek independent financial advice before making trading decisions.
More news
Signal Performance Review - January 2026
All performance figures shown are simulated and do not reflect actual trading results. No real money was invested, and actual results may differ...
Signal Performance Review - December 2025
All performance figures shown are simulated and do not reflect actual trading results. No real money was invested, and actual results may differ...