Key Update
November 4, 2025
By Joe Neighbour
See profile
All performance figures shown are simulated and do not reflect actual trading results. No real money was invested, and actual results may differ materially
October brought varied market conditions across asset classes, with persistent dollar strength, a sharp reversal in gold, and mixed equity momentum shaping trading opportunities. FX Crosses led performance as clean technical structures supported consistent execution, while commodities and major indices faced more challenging price dynamics. This report breaks down the month’s key market drivers, strategy outcomes, and standout trade insights..
Asset Class Summary
Forex
The dollar traded unevenly through October, with the DXY holding inside a broad range as shifting Fed-cut expectations and U.S. fiscal uncertainty kept direction mixed. EUR/USD and GBP/USD maintained a firmer tone overall, while USD/JPY stayed elevated but constrained by continued intervention watch. Commodity FX such as AUD/USD and NZD/USD benefited from improved risk sentiment, creating favourable opportunities for selective trend and range-based positioning.
Indices
Equity markets extended their broader uptrend, though price action turned less decisive. The S&P 500 and Nasdaq 100 remained near highs, while the STOXX 600 and FTSE 100 saw steadier, more rotational gains across sectors. Late-month volatility picked up as investors weighed valuation risks and policy uncertainty, but overall conditions stayed constructive for dip-buying approaches.
Commodities
Gold saw a sharp reversal on 21 October, pulling back decisively from recent highs and failing to reclaim those levels into month-end. Oil remained soft, weighed by supply expectations and uneven demand indicators, while industrial metals traded mixed.
Cryptocurrencies
Crypto remained volatile but broadly supported. Bitcoin consolidated below recent peaks, while ETH tracked a similar range-bound profile. Institutional participation continued to underpin sentiment even as intraday swings persisted.
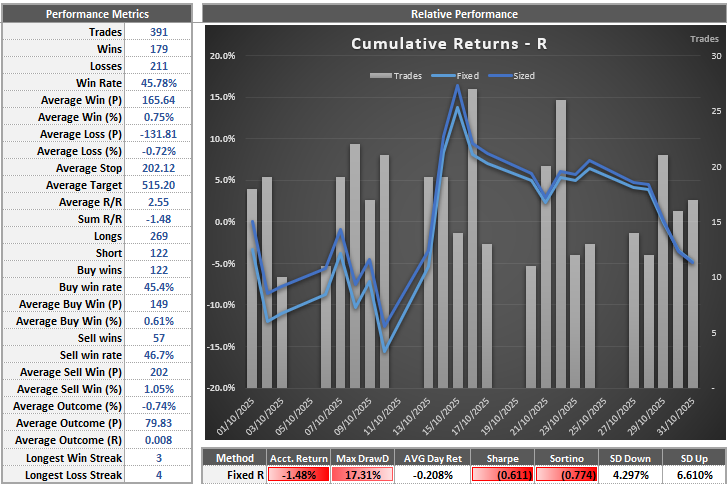
The simulated performance statistics provided are based on the assumption of risking 1% of trading capital per trade. It is crucial to understand that past performance, whether actual or simulated, is not indicative of future results.
12 month simulated performance statistics
| Nov 24 | Dec 24 | Jan 25 | Feb 25 | Mar 25 | Apr 25 | May 25 | June 25 | July 25 | August 25 | Sept 25 | Oct 25 |
| -15.68% | 27.29% | 12.66% | 16.50% | -7.53% | -19.13% | 19.22% | 34.08% | -20.56% | -8.70% | 0.69% | -1.48% |
Asset Class Performance
For October, performance was led decisively by FX Crosses, which delivered a strong 15.70% return across 104 trades. A 50% win rate and a relatively contained -4.76% drawdown highlighted disciplined execution and effective risk control, establishing this segment as the standout contributor for the month.
Cryptocurrencies also finished in positive territory, returning 3.63% over 46 trades. While the 45.65% win rate and -4.36% drawdown reflect moderate volatility, this asset class continued to show improving stability and follow-through compared to earlier months.
Elsewhere, performance was weaker. FX Majors posted a -5.49% return from 77 trades, with a 42.86% win rate and -8.43% drawdown indicating challenging conditions and limited trend persistence. Indices likewise struggled, recording a -5.45% return across 96 trades, as a 43.75% win rate and -8.32% drawdown pointed to choppy price action and difficulty capturing sustained moves.
The most significant drag came from Commodities, which fell -9.87% over 68 trades, accompanied by the largest drawdown at -16.20%. Despite selective opportunities, this segment continued to face elevated volatility and uneven directional structure.
In summary, FX Crosses remained the key driver of performance, supported by positive results in Cryptocurrencies, while FX Majors, Indices, and particularly Commodities acted as headwinds. The month underscored the importance of diversification and maintaining discipline amid divergent conditions across asset classes.
| Asset Class | Trades | Win Rate | Returns | Drawdown |
| FX Majors | 77 | 42.86% | -5.49% | -8.43% |
| FX Crosses | 104 | 50.00% | 15.70% | -4.76% |
| Commodities | 68 | 45.59% | -9.87% | -16.20% |
| Indices | 96 | 43.75% | -5.45% | -8.32% |
| Cryptocurrencies | 46 | 45.65% | 3.63% | -4.36% |
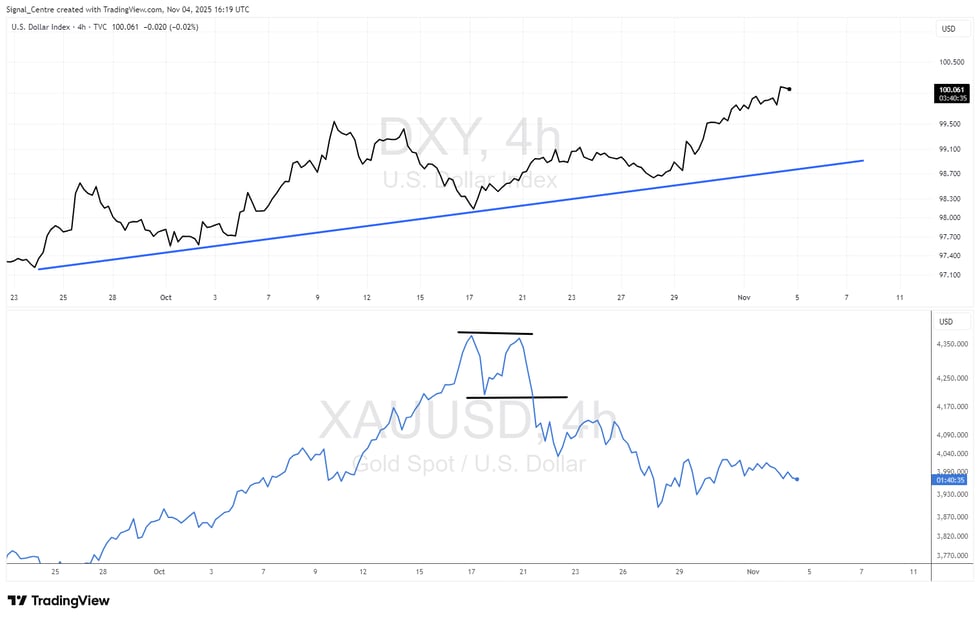
The chart below (black line) shows the Dollar Index (DXY), which extended its recovery through October. The trend remained firmly positive across the month, supported by improving momentum and resilient U.S. data. While the dollar’s strength typically favours USD-linked instruments, this period saw our strongest performance come instead from non-USD FX Crosses, where a mix of steady directional moves and well-defined trading ranges created favourable conditions.
The blue line represents Gold, which continued to build on its strong multi-month rally early in October. However, momentum began to fade mid-month, and around the 21st we saw a sharp shift in behaviour — highlighted by a decisive bearish engulfing candle and a completed double-top pattern on shorter-term charts. This reversal triggered a meaningful pullback, signalling that the extended uptrend may now be pausing or entering a corrective phase.
Overall, October underscored the benefit of flexibility across asset classes. While the U.S. dollar strengthened firmly, opportunity was greatest in FX Crosses, where clearer structures supported trade execution. In contrast, precious metals offered a reminder of how quickly sentiment can shift after an extended trend. Staying responsive to evolving market conditions remains key as we move deeper into Q4.
Best/Worst Performing Markets
For the current month, performance was led by USDMXN, which returned 9.49% across 16 trades (all long positions). With a strong 68.75% win rate and a minimal -0.35% drawdown, the pair delivered both outstanding profitability and excellent risk control, making it the best-performing instrument of the period.
Ethereum followed with a solid 6.82% return from 12 trades (8 long, 4 short). Despite a balanced 50% win rate, disciplined position management helped keep drawdown contained at -1.31%, allowing the strategy to extract meaningful upside from crypto market volatility.
Oil also performed well, recording a 4.38% gain over 9 trades (6 long, 3 short). A strong 77.78% win rate combined with a shallow -1.21% drawdown reflected highly selective and effective trade execution, contributing reliably to overall results.
| Best | Trades | Long | Short | Win Rate | Returns | Drawdown |
| USDMXN | 16 | 16 | 0 | 68.75% | 9.49% | -0.35% |
| ETHEREUM | 12 | 8 | 4 | 50.00% | 6.82% | -1.31% |
| OIL | 9 | 6 | 3 | 77.78% | 4.38% | -1.21% |
For the month, the weakest performance came from EURUSD, which posted a loss of -4.72% across 10 trades (6 long, 4 short). A 30.00% win rate and a -4.97% drawdown highlighted challenging conditions and difficulty establishing sustained directional conviction in the pair.
Palladium followed, declining -4.56% over 13 trades (8 long, 5 short). Despite a slightly higher 30.77% win rate, the segment still faced a -4.92% drawdown, reflecting choppy commodity price action and limited follow-through on setups.
Gold also underperformed, returning -4.00% from 4 trades (3 long, 1 short). With no winning trades recorded (0% win rate) and a matching -4.00% drawdown, execution proved especially difficult amid sharp reversals and increased volatility in precious metals.
| Worst | Trades | Long | Short | Win Rate | Returns | Drawdown |
| GOLD | 4 | 3 | 1 | 0.00% | -4.00% | -4.00% |
| PALLADIUM | 13 | 8 | 5 | 30.77% | -4.56% | -4.92% |
| EURUSD | 10 | 6 | 4 | 30.00% | -4.72% | -4.97% |
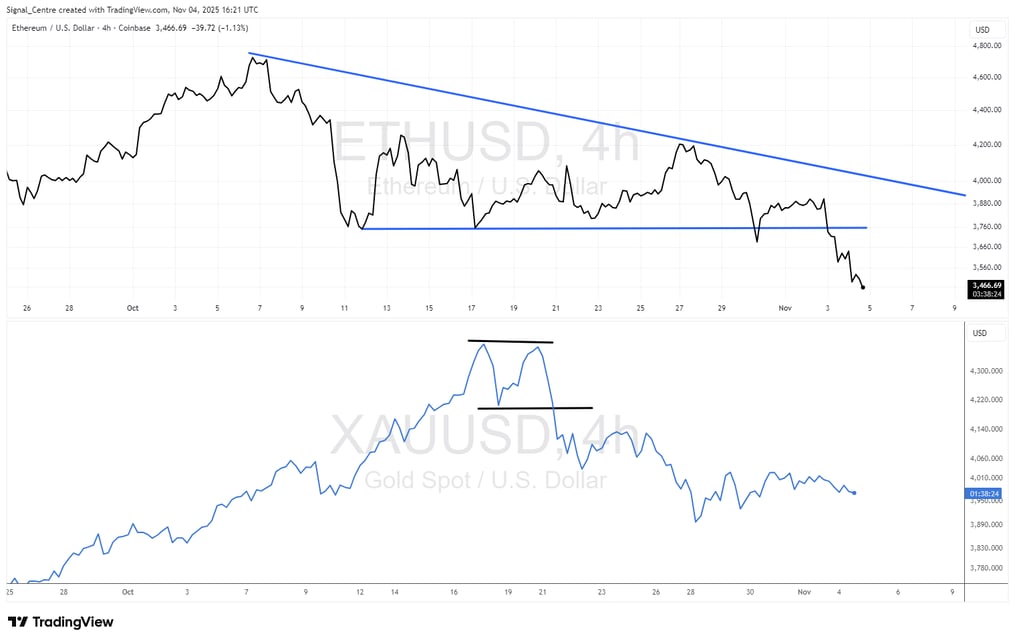
The chart below highlights ETHUSD (black), which was a key focus over the month. Price action maintained a clear bearish structure, leading us to execute 8 short trades out of 12 total positions. Firm support around 3753 provided opportunities for selective counter-trend trades, but the broader downside pressure remained dominant. As we moved into early November, this support level broke decisively, indicating the potential for further near-term weakness and continuation of the prevailing downtrend.
In contrast, Gold (blue) delivered a very different profile. After an extended and powerful bullish trend in recent months, price momentum began to falter in October. Around the 21st, we observed a sharp increase in volatility, with a large bearish engulfing daily candle coinciding with the completion of a double-top formation on the 4-hour chart. This technical breakdown triggered a meaningful correction and suggests that the broader bull cycle may now be pausing—or potentially shifting—after an extended advance.
Major Macroeconomic Data
Here is a snapshot of how our trade ideas performed on the day of key macroeconomic data.
Non Farm Payrolls - No Release Due to Government Shut Down in the US.
US CPI (YoY) - 24th September 2025
| Event | Date | Trades Triggered | Win Rate | Return |
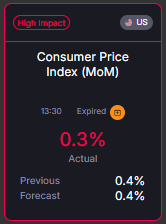
| US CPI (MoM) | 24/10/2025 | 13 | 38.46% | 1.74% |
The U.S. CPI release for the month came in below expectations at 0.3% vs. 0.4% forecast, prompting a sharp reversal in the U.S. Dollar, which had been trending higher into the event. Our positioning was aligned for this scenario, and as the dollar weakened post-print, our strategies were able to capitalise on the shift.
We generated a 1.74% return on the day across 13 trades, with notable gains in USDMXN, EURNZD, Oil, and the DAX. Overall, the lower-than-expected inflation reading helped reinforce the tactical setup, resulting in a well-executed response to the macro event and positive performance contribution.
Trade of the Month - ETHEREUM - 7th October 2025
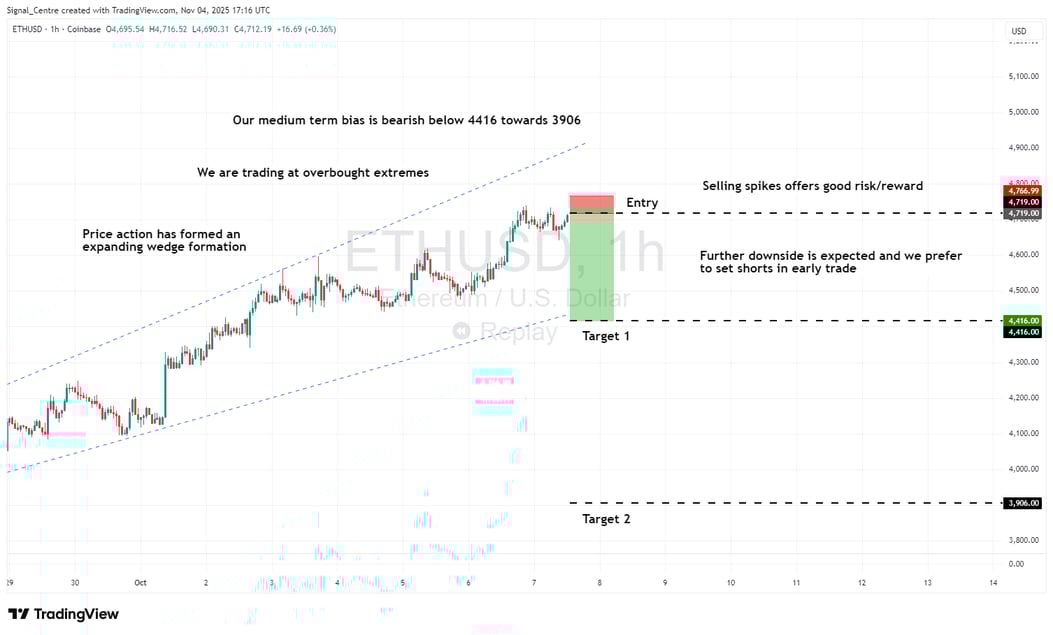
Ethereum was our top-performing market in October, producing three trades that each returned more than 2R. Our analysts concentrated on the asset as it approached a key resistance zone just below its prior all-time high, signalling the potential for an imminent reversal. While this setup carried elevated risk, the structure offered compelling risk-reward. We executed short positions into a bespoke resistance level, targeting a tactical pullback, with clearly defined entries and strict risk parameters guided by our chart analysis. This disciplined approach highlights how we identify high-conviction opportunities and act decisively when market structure aligns with our methodology.
- Direction: Sell
- Entry Level: 4719
- Stop: 4799
- Target 1: 4416
- Target 2: 3906
- Risk/Reward: 1 : 3.71
The setup
-
Price action has formed an expanding wedge formation
-
Our medium term bias is bearish below 4416 towards 3906
-
Selling spikes offers good risk/reward
-
We are trading at overbought extremes
-
Further downside is expected and we prefer to set shorts in early trade
Here's a graphical depiction illustrating the trade setup and the analytical process behind ETHEREUM.
The Outcome
The trade triggered exactly at our predefined entry level at 13:45, following a brief rally into resistance. Price quickly reversed from the specified zone, and bearish momentum continued throughout the session. Drawdown was contained to just 40.44 pips, reflecting precise placement and strong structure. The first profit target at 4416 was reached at 05:10 on 8 October, and the second target at 3906 was achieved two days later, on 10 October at 21:50.
Published: 13:09 UK (7th October 2025)
Triggered at: 13:45 UK (7th October 2025)
Exit at: 05:10 UK - (8th October 2025)
Duration: 15 Hours and 25 minutes
Outcome: 3.79R
Overall, October emphasised the value of flexibility and disciplined risk management across shifting market environments. Strong returns in FX Crosses and strategic positioning in crypto offset weakness in commodities and major indices, while macro event-driven trades—most notably around U.S. CPI—added to results. With volatility rising into year-end, maintaining a balanced approach and adapting to evolving price structure remains central to our trading framework.
Thank you for your continued trust in Acuity Trading. Stay tuned for more updates and insights in the coming months.
Acuity Research is authorised and regulated by the Financial Conduct Authority (FCA), firm reference number 787261
Risk Warning
The simulated performance statistics provided are based on the assumption of risking 1% of trading capital per trade. It is crucial to understand that past performance, whether actual or simulated, is not indicative of future results. Trading involves substantial risk and is not suitable for every investor. The figures presented are hypothetical and do not account for real market conditions, such as liquidity, slippage, or transaction costs. You should be aware of the risks involved and be prepared to potentially lose your entire investment. Always seek independent financial advice before making trading decisions.
More news
Signal Performance Review - January 2026
All performance figures shown are simulated and do not reflect actual trading results. No real money was invested, and actual results may differ...
Signal Performance Review - December 2025
All performance figures shown are simulated and do not reflect actual trading results. No real money was invested, and actual results may differ...